DIY Custom Strategy Builder [ZP] - v1DISCLAIMER:
This indicator as my first ever Tradingview indicator, has been developed for my personal trading analysis, consolidating various powerful indicators that I frequently use. A number of the embedded indicators within this tool are the creations of esteemed Pine Script developers from the TradingView community. In recognition of their contributions, the names of these developers will be prominently displayed alongside the respective indicator names. My selection of these indicators is rooted in my own experience and reflects those that have proven most effective for me. Please note that the past performance of any trading system or methodology is not necessarily indicative of future results. Always conduct your own research and due diligence before using any indicator or tool.
===========================================================================
Introducing the ultimate all-in-one DIY strategy builder indicator, With over 30+ famous indicators (some with custom configuration/settings) indicators included, you now have the power to mix and match to create your own custom strategy for shorter time or longer time frames depending on your trading style. Say goodbye to cluttered charts and manual/visual confirmation of multiple indicators and hello to endless possibilities with this indicator.
What it does
==================
This indicator basically help users to do 2 things:
1) Strategy Builder
With more than 30 indicators available, you can select any combination you prefer and the indicator will generate buy and sell signals accordingly. Alternative to the time-consuming process of manually confirming signals from multiple indicators! This indicator streamlines the process by automatically printing buy and sell signals based on your chosen combination of indicators. No more staring at the screen for hours on end, simply set up alerts and let the indicator do the work for you.
Available indicators that you can choose to build your strategy, are coded to seamlessly print the BUY and SELL signal upon confirmation of all selected indicators:
EMA Filter
2 EMA Cross
3 EMA Cross
Range Filter (Guikroth)
SuperTrend
Ichimoku Cloud
SuperIchi (LuxAlgo)
B-Xtrender (QuantTherapy)
Bull Bear Power Trend (Dreadblitz)
VWAP
BB Oscillator (Veryfid)
Trend Meter (Lij_MC)
Chandelier Exit (Everget)
CCI
Awesome Oscillator
DMI ( Adx )
Parabolic SAR
Waddah Attar Explosion (Shayankm)
Volatility Oscillator (Veryfid)
Damiani Volatility ( DV ) (RichardoSantos)
Stochastic
RSI
MACD
SSL Channel (ErwinBeckers)
Schaff Trend Cycle ( STC ) (LazyBear)
Chaikin Money Flow
Volume
Wolfpack Id (Darrellfischer1)
QQE Mod (Mihkhel00)
Hull Suite (Insilico)
Vortex Indicator
2) Overlay Indicators
Access the full potential of this indicator using the SWITCH BOARD section! Here, you have the ability to turn on and plot up to 14 of the included indicators on your chart. Simply select from the following options:
EMA
Support/Resistance (HeWhoMustNotBeNamed)
Supply/ Demand Zone ( SMC ) (Pmgjiv)
Parabolic SAR
Ichimoku Cloud
Superichi (LuxAlgo)
SuperTrend
Range Filter (Guikroth)
Average True Range (ATR)
VWAP
Schaff Trend Cycle ( STC ) (LazyBear)
PVSRA (TradersReality)
Liquidity Zone/Vector Candle Zone (TradersReality)
Market Sessions (Aurocks_AIF)
How it does it
==================
To explain how this indictor generate signal or does what it does, its best to put in points.
I have coded the strategy for each of the indicator, for some of the indicator you will see the option to choose strategy variation, these variants are either famous among the traders or its the ones I found more accurate based on my usage. By coding the strategy I will have the BUY and SELL signal generated by each indicator in the backend.
Next, the indicator will identify your selected LEADING INDICATOR and the CONFIRMATION INDICATOR(s).
On each candle close, the indicator will check if the selected LEADING INDICATOR generates signal (long or short).
Once the leading indicator generates the signal, then the indicator will scan each of the selected CONFIRMATION INDICATORS on candle close to check if any of the CONFIRMATION INDICATOR generated signal (long or short).
Until this point, all the process is happening in the backend, the indicator will print LONG or SHORT signal on the chart ONLY if LEADING INDICATOR and all the selected CONFIRMATION INDICATORS generates signal on candle close. example for long signal, the LEADING INDICATOR and all selected CONFIRMATION INDICATORS must print long signal.
The dashboard table will show your selected LEADING and CONFIRMATION INDICATORS and if LEADING or the CONFIRMATION INDICATORS have generated signal. Signal generated by LEADING and CONFIRMATION indicator whether long or short, is indicated by tick icon ✔. and if any of the selected CONFIRMATION or LEADING indicator does not generate signal on candle close, it will be indicated with cross symbol ✖.
how to use this indicator
==============================
Using the indicator is pretty simple, but it depends on your goal, whether you want to use it for overlaying the available indicators or using it to build your strategy or for both.
To use for Building your strategy: Select your LEADING INDICATOR, and then select your CONFIRMATION INDICATOR(s). if on candle close all the indicators generate signal, then this indicator will print SHORT or LONG signal on the chart for your entry. There are plenty of indicators you can use to build your strategy, some indicators are best for longer time frame setups while others are responsive indicators that are best for short time frame.
To use for overlaying the indicators: Open the setting of this indicator and scroll to the SWITCHBOARD section, from there you can select which indicator you want to plot on the chart.
For each of the listed indicators, you have the flexibility to customize the settings and configurations to suit your preferences. simply open indicator setting and scroll down, you will find configuration for each of the indicators used.
I will also release the Strategy Backtester for this indicator soon.
Cerca negli script per "Ichimoku Cloud "

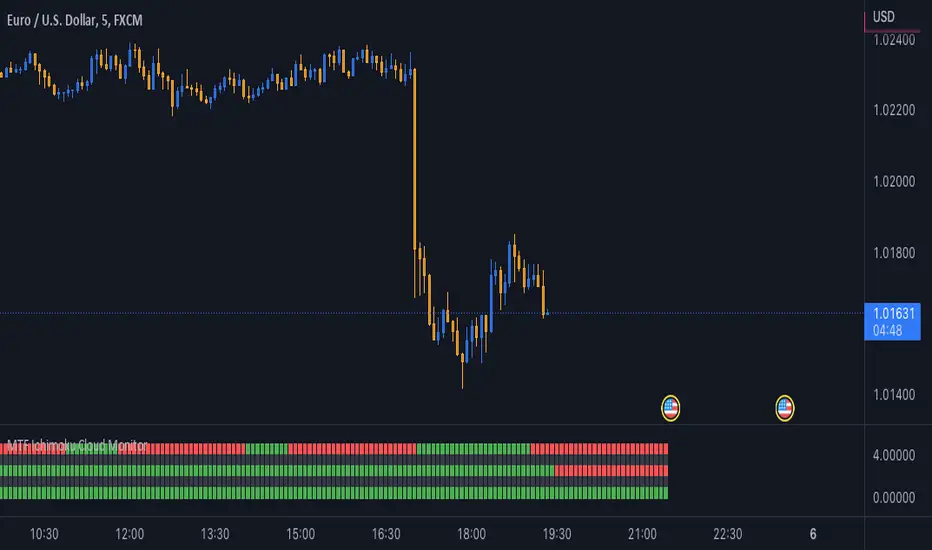
MTF Ichimoku Cloud MonitorIchimoku Kinko Hyo is a technical analysis method that builds on candlestick charting to improve the accuracy of forecast price moves.
his Indicator build for Monitor SenkouSpanA & SenkouSpanB Lines (Kumo Cloud) status and you can watch 3 Time Frames Status on one bar and in one timeframe.
You can select timeframe and set Inputs for lines from Indicator setting.
Good trading to all ...
Ichimoku Kinko HyoThis indicator is adding to the original indicator Ichimoku Cloud some visual informations.
Be aware of settings that are by default 10, 30, 60, while in the original indicator, default settings are 9, 26, 52. These are commonly consider like "crypto settings".
Tenkan = blue line
Kijun = orange line
SSB = red line
This indicator display three categories of signals that are given by the Ichimoku indicator:
- tenkan / kijun crosses ;
- breaks of mid prices for the different time horizon ;
- bar coloring depending of the trend
Let's review more in deep each of these elements.
Tenkan / Kijun crosses
When the tenkan crossover the kijun, this is called gold cross and it's display by a green triangle at the bottom of the chart.
When the tenkan crossunder the kijun, this is called death cross and it's display by a red triangle at the top of the chart.
I advise to not enter long or short only on this signal because it can be fake, especially during ranges.
To confirm the signal, we need to wait for a movement of the kijun in the same side of the cross. See first arrow on the chart.
Breaks of mid prices
Ichimoku is composed of three han-le lines that displays mid-price of the last candles depending on the settings (10, 30, 60).
Tenkan show us the mid-price of the last 10 candles (short term)
Kijun show us the mid-price of the last 30 candles (mid term)
SSB show us the mid-price of the last 60 candles (long term)
Break of tenkan by the price is the first signal that Ichimoku gives us before a reversal of the trend. This signal is display by a blue triangle.
Then, happened the break of kijun line follow by the break of the SSB. These are display respectively by an orange triangle and a red triangle.
Same advise, don't enter long or short only on break of these lines.
However, tenkan and kijun breaks can be used as exit point.
Bar coloring
The bar coloring display the strength of the trend:
- green candle: strong bullish trend - this happen when the current price is above tenkan, kijun and SSB ;
- blue candle: potential starting of a bullish trend - this happen when the current price is above tenkan and kijun but below the SSB ;
- no colored candle: no trend, market is in a range - this happen when the current price is above tenkan and below kijun and SSB or when the current price is below tenkan and above kijun and SSB ;
- orange candle: potential starting of a bearish trend - this happen when the current price is below tenkan and kijun but above SSB ;
- red candle: strong bearish trend - this happen when the current price is below tenkan, kijun and SSB
How to use to enter / exit trades
First of all, we need confirmations to enter in the side of the trend.
The first signal that the indicator gives us is the break of tenkan, follow by the break of kijun. Candles becomes blue / orange depending of the side.
Then, we wait for a cross of tenkan and kijun. This cross has to be confirmed by a movement of kijun. A flat kijun tell us this is a fake cross.
When the movement of kijun happened in the same side of the cross it is possible to enter a trade if you are aggresive.
Otherwise, you can wait for the third signal to take place: break of SSB, candle become green / red, depending on the side.
You can then enter a trade.
Then hold the position and wait to exit for break of tenkan or kijun, depending on your horizon (short / mid term).
If you have other questions or some features that are missing, pm me. Thanks.

Playing the crossFor this script i used Kijun-sen from Ichimoku Cloud and Moving Average.
Kijun-sen is the base line of the Ichimoku Cloud or the midpoint price of the last 26 period.
Moving Average is a constantly updated average price of a given range.
In this script i used the standard Kijun-sen settings and the Moving Average, 55 length.
You will get an red or green signal when the lines cross each other.
Try the indicator yourself to see, why it could be useful.
A special thanks to @norok and @happyCloud1537 for teaching me!
This will lead to more scripts from my side, since i really like to code and trade.
1 Indicator to rule them allThe best combination indicator consisting of 4 SMA's, 4 EMA's, Donchian Channels, Parabolic SAR, Bollinger Bands, Ichimoku Cloud, a trend strength highlight for the bollinger bands background according to the ADX, labels on the chart to draw in when the Directional Index plus and minus cross, and a background highlight for low and high volatility according to the Historical Volatility Percentile.
The Indicators and placed and group intentionally, with the SMA and EMA's next to the Donchian Channels to draw in areas of support and resistance, with the parabolic SAR afterwards for confirmation on entries and exits.
Next are the Bollinger Bands and the Ichimoku cloud, which when used in combination by an experienced trader allows one to see the trend and spot any developing opportunities at a glance. These can be used in combination with the ADX background in the bolls to point out when trends start and end.
The Directional Indexes crossing implies a equilibrium point has been reached between the buy and selling pressure. Finally the background highlight according to low and high periods of volatility does well to ensure you're entering into the best trades at the best times.
These indicators used together in combo with momentum oscillators will lead to a full and complete picture of the trend and the most likely places for future price to come, allowing a holistic view and confluence between different, noncollinear indicators to paint occam's razor onto the charts.

ChikouLibrary "Chikou"
This library contains Chikou Filter function to enhances functionality of Chikou-Span from Ichimoku Cloud using a simple trend filter.
Chikou is basically close value of ticker offset to close and it is a good for indicating if close value has crossed potential Support/Resistance zone from past. Chikou is usually used with 26 period.
Chikou filter uses a lookback length calculated from provided lookback percentage and checks if trend was bullish or bearish within that lookback period.
Bullish : Trend is bullish if Chikou span is above high values of all candles within defined lookback period. Bull color shows bullish trend .
Bearish : Trend is bearish if Chikou span is below low values of all candles within defined lookback period. This is indicated by Bearish color.
Reversal / Choppiness : Reversal color indicates that Chikou are swinging around candles within defined lookback period which is an indication of consolidation or trend reversal.
chikou(src, len, perc, _high, _low, bull_col, bear_col, r_col) Chikou Filter for Ichimoku Cloud with Color and Signal Output
Parameters:
src : Price Source (better to use (OHLC4+high+low/3 instead of default close value)
len : Chikou Legth (displaced source value)
perc : Percentage lookback period for Chikou Filter with defined how much candels of total length should be considered for backward filteration
_high : Ticker High Value
_low : Ticker Low Value
bull_col : Color to be returned if source value is greater than all candels within provided lookback percentage.
bear_col : Color to be returned if source value is lower than all candels within provided lookback percentage.
r_col : Color to be returned if source value is swinging around candles within defined lookback period which is an indication of consolidation or trend reversal.
Returns: Color based on trend. 'bull_col' if trend is bullish, 'bear_col' if trend is bearish. 'r_col' if no prominent trend. Integer Signal is also returned as 1 for Bullish, -1 for Bearish and 0 for no prominent trend.

Ichimoku EMA RSI - Crypto only long StrategyHey there!
Here I show you an Ichimoku Cloud Strategy.
I discovered the strategy on a YouTube channel and tried to transfer it as a strategy into a script.
He said in his video that you would make more profit with this strategy than holding the coin.
Tested with the crypto pair ETH/USDT in the four hour chart.
Period: beginning of 2017 until today.
The strategy should also work with foreign exchange. But then the settings have to be adjusted.
There is the possibility to activate two EMA's and a Stochastic RSI .
-----------------------------------------------------------------------------------
How does the strategy work?
ENTRY
The green Ichimoku lead line must above the red Ichimoku lead line - only the two lead lines are activated.
A green candle must closed above the green lead line.
EXIT
A red candle must close below the green Ichimoku lead line.
OPTIONAL ENTRY
EMA
Once you activate the EMA , long positions will only be taken once the EMA1 is above the EMA2.
Thereby I could observe a significant increase of the profit as well as a decrease of the maximum drawdown.
RSI
As soon as you activate the Stochastic RSI , long positions are only taken when the K line is above the D line.
In the future, I may add an oversold - undersold parameter.
The results of the strategy are without commissions and levers.
If you have any questions or feedback, please let me know in the comments.
If you need more information about the strategy and want to know exactly how to apply it, check out my profile.
I wish you good luck with the strategy!

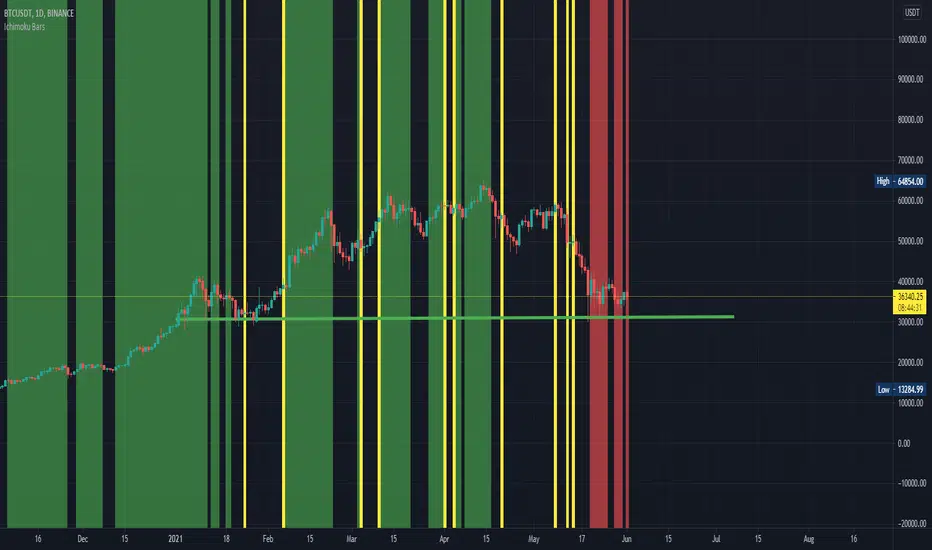
Ichimoku BarsThis script follows off the principles of the Ichimoku Cloud indicator. The green zones display optimal time to buy according to the Ichimoku model. The red zones show optimal time to sell according to the Ichimoku model inverse. The yellow zones show where the conversion line meets the base line (potential up or down movement at this point). Feel free to contact me to fix any problems or add additional info.
Trend Indicators CollectionAnalyses MACD crosses with Ichimoku cloud direction and state
General idea:
- MACD crosses usually point to a change in trend direction and Kumo state and direction often act as a confirmation as well as a trend strength indicator. Using this, the script points out where there were was or can be a point where the trend change may have the strength to carry on.
Buy warnings:
- This warning will be triggered in two ways, both of them only if MACD is above EMA and the current close price is over Kumo:
- Senku span A crosses over Senku B (Kumo turns positive) when MACD is already positive
- MACD turns positive when Kumo is already positive
Sell warnings
- Triggered in two ways:
- Kumo turns negative when the current close price is bellow EMA
- The inverse of the above, the current close price falls bellow EMA when the Kumo is already negative
Trend Indicators Collection (TIC) contains:
- MACD, EMA, ADX, Mass index, Ichimoku Cloud, and Pivot points
- Best suited for monthly charts with 30m bars

Multi StrategyDuring the course of a trade, we can find ourselves changing strategies depending on the market. Instead of using many different templates, I have a simple indicator that clearly says "Buy", "Sell" or "Stay Out". The great thing about this approach, is we instantly observe the majority are in agreement and that decides which way to place our trade.
This indicator includes the following strategies:
- QQE
- Ichimoku using much faster settings.
- Parabolic SAR
- Supertrend
- TTM Oscillator
- The Squeeze strategy
- The Alligator Strategy
Using this indicator is simple, if the lines are mainly green then buy, if mainly red then sell OR don't trade. So...
Green Line - This strategy is in a buy position
Orange or Black Line - This strategy is undecided
Red Line - This strategy is in a sell position
There are also some green and red circles for reference that appear showing when that bar has broken through the Ichimoku cloud.
The trader's approach is simple, when all indicators are green or red, then take the trade. As soon as one indicator changes, then re-evaluate using your normal process, such as price action, to determine whether to close the trade or continue.
I can customise this further or add other strategies, please message me.

Gator RibbonThere's nothing fancy here--I just like the look of this one. And it works pretty well. This started out as the standard Alligator indicator. There I reset all the offsets to 0 and added an Ichimoku Cloudish fill.
Astute observers will notice a fourth line has been added at 34 SMA. It's a bit of a cheat. 34 SMA is the zero line of another classic B. Williams indicator, the Awesome Oscillator. When the green line crosses over 34 SMA, it's quite likely the Awesome Oscillator will have changed sentiment as well. It also makes a nice loose trailing stop loss reference if you're hoping to get into some long trends.

Ichimoku Bollinger BandsThis indicator is a standard set of Bollinger Bands with some functionality borrowed from Ichimoku Kinko Hyo. There's an added SMA (9) that gets shaded green when it's above the basis line of the Bollinger Bands (SMA 20) and turns red when it falls below. No, it's not remotely where the Ichimoku Cloud would appear, but it's a decent trend indicator regardless.
You also get Ichimoku's Lagging Span to help verify the strength of the trend. When the Lagging Span rises above the price history, the trend is up. When the Lagging Span rises above the Bollinger Bands, the uptrend is super strong. And the opposite conditions signal downtrends.
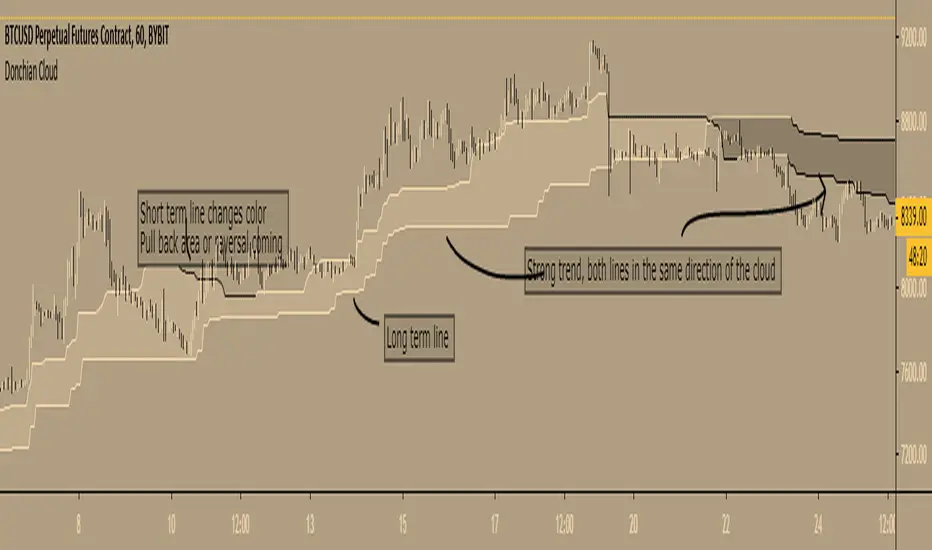
Donchian Cloud - evoA cloud based on the highest high and lowest low of a given period (Donchian), same lines used in Ichimoku Cloud (Conversion line or Base line).
Short term line is based on current time frame, long term line is based on your given multiple of current time frame.
The color of the lines is based on up or down movement.
I stole a piece of code from PineCoders for the multiple time frame:
I have not used this in my trades (yet) so I don't know how good it is, just posting because it looks nice :)
Feel free to share your settings if you can find good ones.
Auto IchimokuA strategy where entries are calculated for you using the Ichimoku Cloud. The IC isn't plotted though, just a heads up.

ULTIMATE ICHIMOKU TRADING SUITEThis is an update of "Uncle Mo's Ultimate Ichimoku V1"
Main features:
2 x Ichimoku Cloud
5 x EMA
2 x MA
1 x HullMA
Williams Fractal
Bollinger Bands - ***NEW***
ATR - ***NEW***
PSAR - ***NEW***
Candlestick Patterns - ***NEW***
Price Action Bars- ***NEW***
List of credits:
@br0qn for the Ichimoku
@RicardoSantos for the Bill Williams Fractal
@EmilianoMesa for the EMAs/MAs
@mohamed982 for the HullMA
@ymaheshreddy4u for the Bollinger Bands
@ChrisMoody for the Price Action Bars and PSAR
@HPotter for the ATR
@repo32 for the Candlestick Patterns
The script is open source and free to use. Feel free to change it around to suit your needs.
***If you copy & paste code from other traders to make your own script, please do remember to give them credit for their amazing work.***
Happy trading!

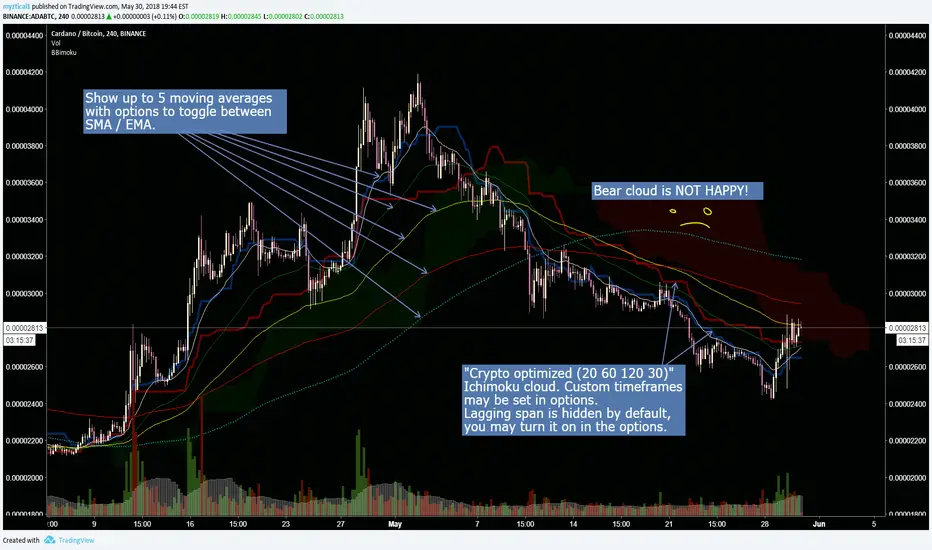
Crypto optimized Ichimoku and 5 variable SMA / EMAThis script has the option for showing up to 5 moving averages with options to toggle between SMA / EMA. Also includes crypto optimized Ichimoku cloud.
********This script was pieced together from various other's contributions from this site, and I cannot remember who the original authors are*******
Im just combining them to help others with free accounts and limited indicator availability like myself.
I hope this can help someone! Thank you and enjoy.


The Rumpy CloudSimilar basic principle to Ichimoku cloud, more sophisticated implementation.
I've exposed cloud width multipliers in the setting in case anyone wants to experiment with them, there are likely to be other widths of significance.
Lots of lines so settings includes easy batch way of altering color settings.
--------------------------------------
If you find it useful please consider a tip/donation :
BTC - 3BMEXEDyWJ58eXUEALYPadbn1wwWKmf6sA
--------------------------------------
Uncle Mo's Ultimate Ichimoku V1Main features:
2 x Ichimoku Cloud
5 x EMA
2 x MA
1 x HullMA
Williams Fractals
Study is based around trader @br0qn 's Ichimoku script.
Credits also go to:
@RicardoSantos for the Bill Williams Fractals
@EmilianoMesa for the EMAs/MAs
@mohamed982 for the HullMA
The script is open source so please feel free to change it around. I'd greatly appreciate it if you could suggest ways to improve it.
Happy trading!

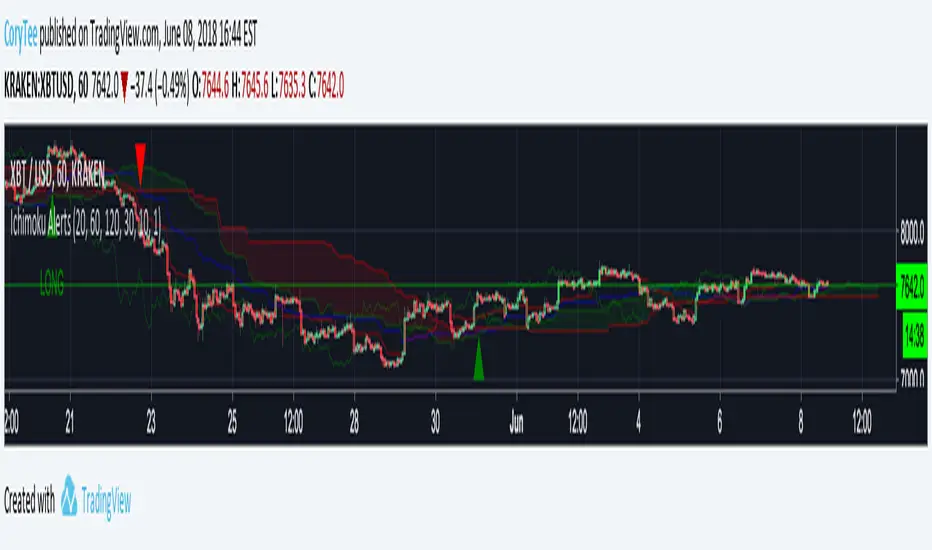
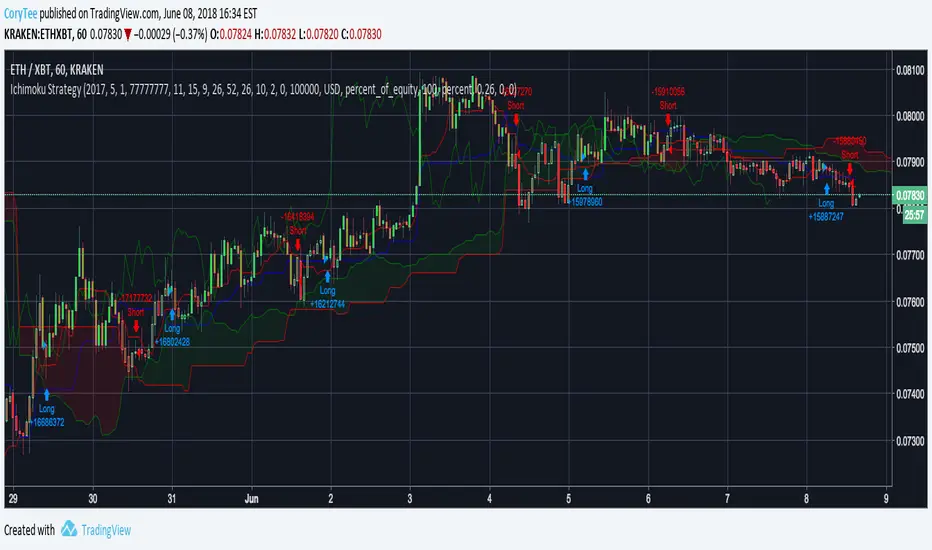
CoryT's Noro's Ichimoku AlertsA few months ago I took Noro's Ichimoku Cloud and used the AV bot template to throw stops on it. I took some code from JustUncleL
to make it not so hideous. Trailing Stops are turned off, stop losses are turned off (you really don't need them with this), and this is currently a Long/Short strategy, the Longs Only and Shorts Only options are broken right now, I'm tired and you guys can either fix it yourselves or deal with it like this for now.
Hint: If you wanna use this as a long-only strategy just have AV close your buy orders whenever a short is triggered.
CoryT's Noro's IchimokuA few months ago I took Noro's Ichimoku Cloud and used the AV bot template to throw stops on it. I took some code from JustUncleL
to make it not so hideous. Trailing Stops are turned off, stop losses are turned off (you really don't need them with this), and this is currently a Long/Short strategy, the Longs Only and Shorts Only options are broken right now, I'm tired and you guys can either fix it yourselves or deal with it like this for now.
Hint: If you wanna use this as a long-only strategy just have AV close your buy orders whenever a short is triggered.
Ichimoku Kumo Twist Strategy with Presets [Krypt]A simple strategy for testing Ichimoku settings used in the following indicator:
